EnergyCheck
WebYour energy rating, your bill and your Walloon grants, in three minutes and without an expert.
In Wallonia, six homes out of ten are rated E, F or G. A homeowner who wants to renovate faces a paid energy certificate that takes weeks, quotes they cannot compare, and Renolution grants they never claim because they do not know they exist. The energy seller has one answer, the installer another, and nobody has a neutral figure.
A homeowner has no way, without an expert and without jargon, to know where their home stands, how much it loses every month, and which work to start with.
A free web app with no account that rebuilds the Walloon energy-rating calculation from a three-minute questionnaire, then prices every loss in euros per month, ranks the work by payback and deducts the regional grants. Four tools share one model: energy diagnosis, footprint score, dashboard and profitability calculator.
A homeowner gets an estimate of their energy rating, the monthly cost of each source of loss and the order to tackle the works, with no expert, no account and no jargon. What used to need a paid appointment now takes three minutes.
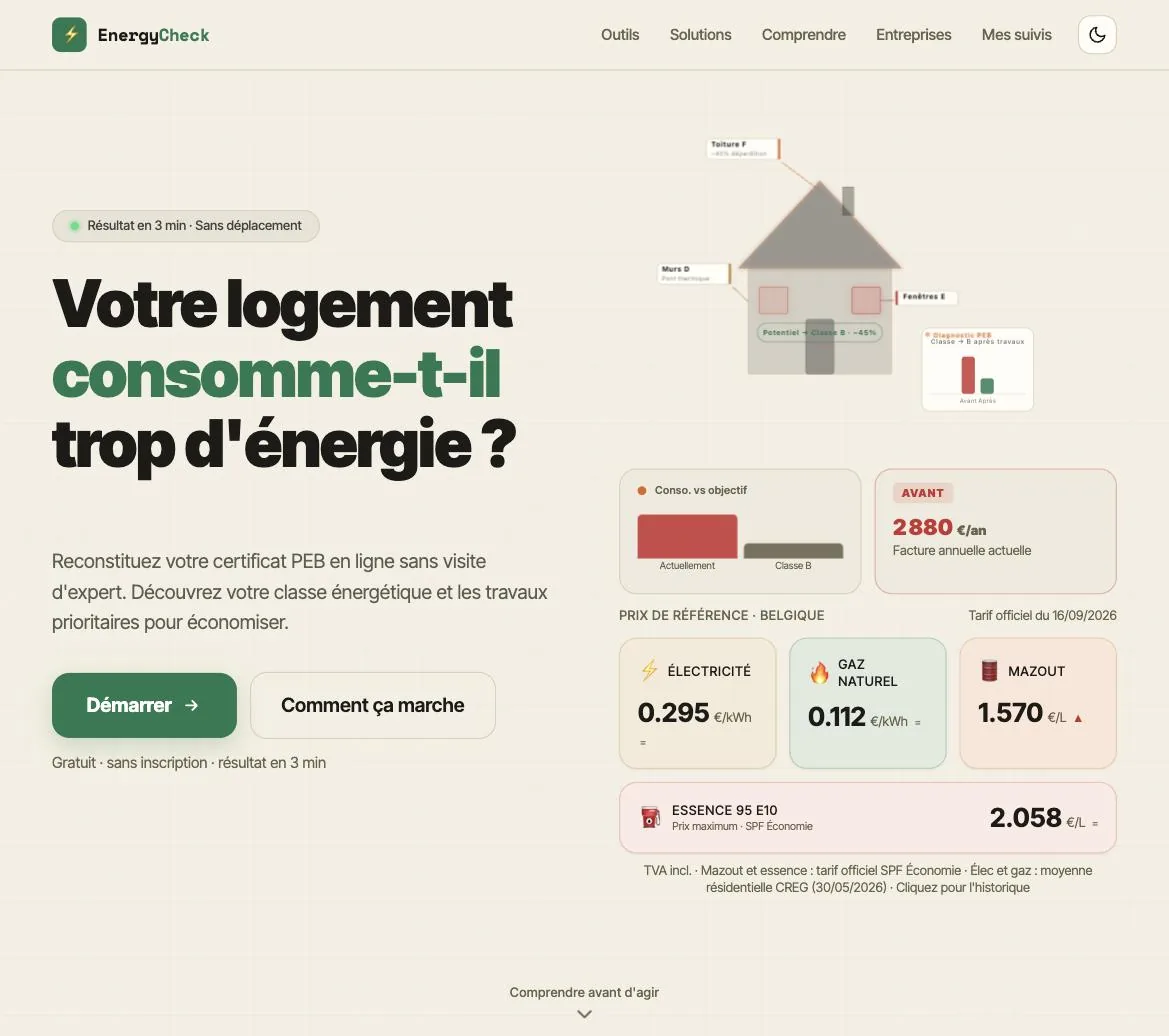
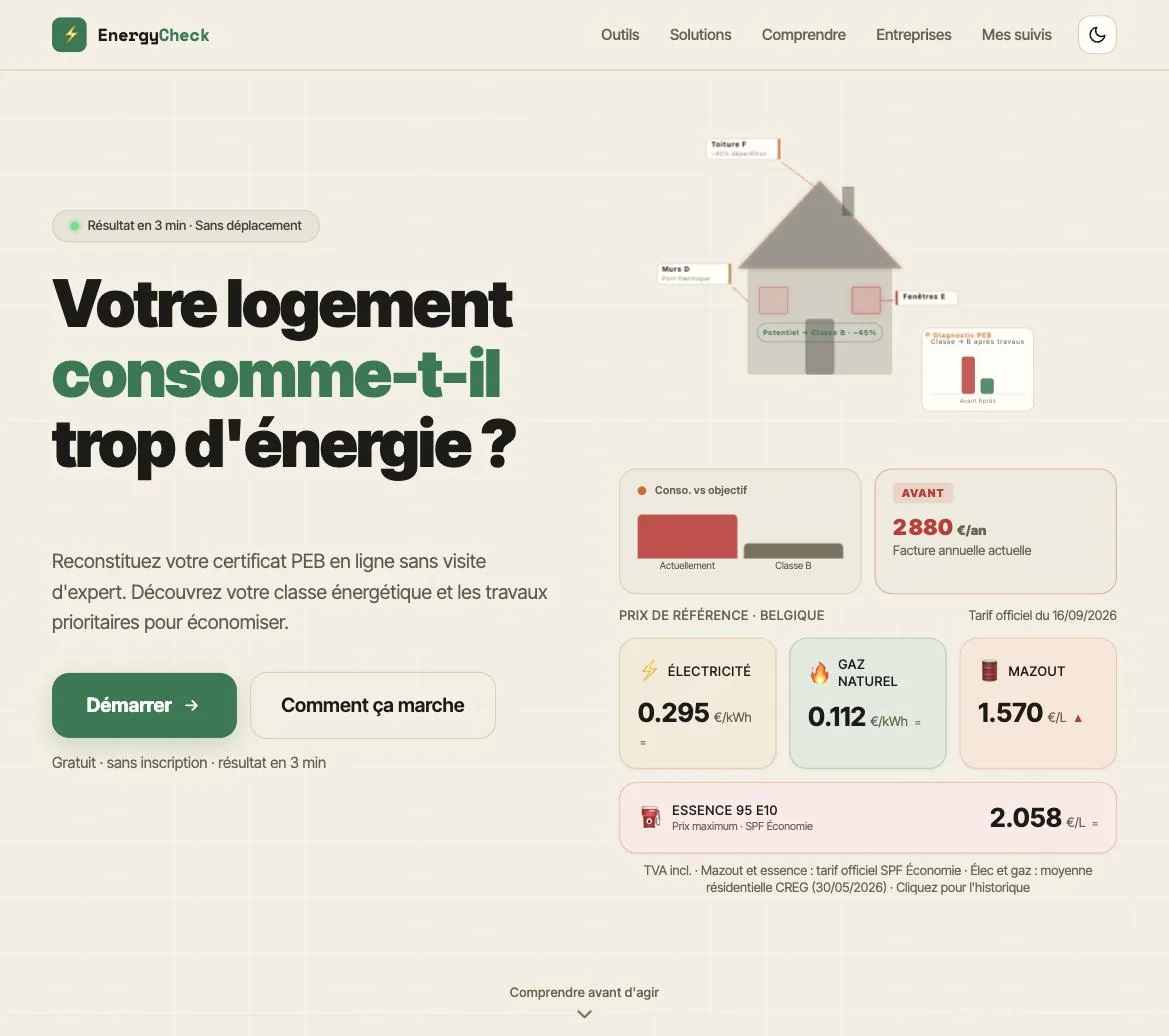
One question, one button. On the right, the annotated house changes with the question asked (rating, footprint, bill, payback), and under it the day's reference prices: the FPS Economy official tariff for heating oil and petrol, the CREG average for electricity and gas, each with its date.
Screenshots of the production site, taken as is. Prices and lead times shown are the site's at capture time.
The real calculation, not a quiz
The engine follows the Walloon energy-rating method: net heat needs by construction period, U-values for walls, roof and glazing, heating efficiency, primary energy factor for electricity. It is calibrated on a real certificate. The result reads in kWh/m².year, the official unit, flagged as estimated, not certified.
A leaking roof ruins the insulation
The questionnaire asks about the roof's condition, not only its insulation. Wet mineral wool loses most of its insulating power, so the model degrades the roof coefficient according to the declared state. That is what lets the diagnosis say start with the roof instead of reciting a generic list.
See where the money escapes
The result is not a table: it is the house as a 3D wireframe, each surface coloured by its condition, energy flows moving through it, and a click on a zone opening its diagnosis. The same number on a model you can rotate sticks; in a table cell, it is forgotten.
Everything in euros per month
Every loss is translated into kWh lost, monthly cost and possible saving, with the price range for the work and the payback time. An energy class does not trigger renovation; 67 euros a month going through the roof does.
Official prices, updated by hand
The reference prices shown everywhere come from the FPS Economy's official tariff for heating oil and petrol, and from the CREG residential average for electricity and gas, each with its validity date. No simulated live feed: a wrong figure with a date on it is worse than no figure.
Alice and Bob, over twenty years
To convince people to act, the site does not promise: it compares. Two neighbours with the same house, one renovates, the other waits, and the curve of cumulative spending over twenty years with energy inflation. The crossing point is the only argument the site allows itself.
- 01The brand green for action and good condition, orange for what needs fixing, red reserved for critical. Three colours, always the same meaning, from the energy gauge to the 3D house.
- 02Charts carry no shadow and no decorative gradient. On a financial simulator, every visual flourish reads as a hint of manipulation.
- 03Every figure carries its source and validity date, right beside it and not in a footnote: FPS Economy, CREG, Renolution.
- 04Every result is expressed in euros per month. It's the only unit a homeowner actually handles.
Something similar in mind?
Describe your situation. I'll tell you what's realistic,
in what order, and what I'd do differently.