Mesurade
WebEurope by the numbers, country by country, with who governed at every point on the curve.
Public data exists, it is official, it is free, and nobody can find it. France's debt, youth unemployment in Spain, prisoners per 100 places in Belgium: it is all published by Eurostat or the Council of Europe, inside twelve-dimensional tables or two-hundred-page PDFs. And the question everyone actually asks is always missing: who was in power at the time?
Official figures are unreadable unless you are a statistician, impossible to compare across countries, and never tied back to the government that was in place.
A web app that crosses three things nobody puts together in open access: a country, an indicator over time, and the country's political composition on the same axis. 32 countries, 40 official indicators, 30 years of history.
A question that used to take a Eurostat spreadsheet and an hour of digging now takes opening a page: the figure, its source, its definition and the government in office, all in one place. The site is live, no account, no paywall.
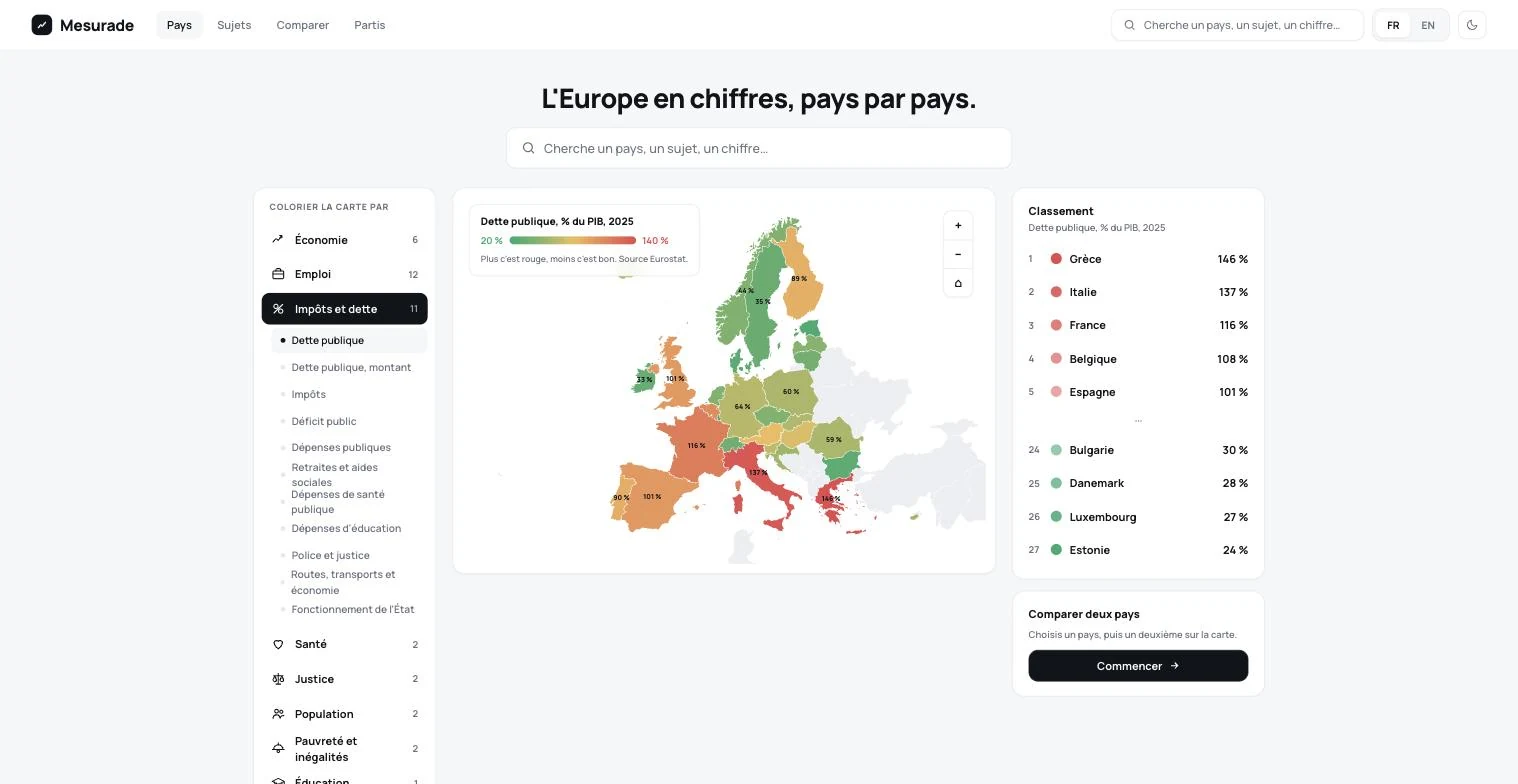
The home page: a map of Europe coloured by the chosen indicator, green when the country sits well, red when it does not, with the full ranking beside it. The legend states how to read it and cites the source before you have clicked anything.
Screenshots of the production site, taken as is. Prices and lead times shown are the site's at capture time.
Three screens, no more
A map of Europe coloured by the chosen indicator with the ranking beside it, one page per country, and a comparison of up to six countries. Everything else was cut: on a data site, every extra screen is a screen to get lost in.
Who governed, under the curve
Under the x-axis, a band in each party's official colour, with the head of government's name. That crossing is what nobody offers in open access, and it is the site's reason to exist.
A number, then its translation
Every value carries a plain-language line turning it into euros or people: 108 % of GDP becomes 692 billion euros, or 58,000 euros per inhabitant. A percentage never gets argued about at dinner, an amount per person does.
The map is computed, not imported
The map projection (Lambert conformal conic) is written by hand, with no mapping library. The render weighs what an SVG weighs, and the map behaves exactly like the rest of the interface.
Nothing gets overwritten
Statistics get revised retroactively: the database keeps every vintage of an observation instead of replacing the old value. Every figure carries its source, its exact definition, its update date and a comparable yes/no flag.
A pipe, not an opinion
No in-house score, no invented ranking, no verdict. Even the parties' ideological placement is never decided by the site: it shows the Chapel Hill Expert Survey and cites the source. The only reminder shown everywhere: a policy takes years to produce its effects.
- 01Colour is reserved for the data. Red when a country sits badly, green when it sits well, a gradient between the two on the map. Everything else in the interface is grey or black.
- 02A single typeface, weights 500 to 800, on a light ground with white rounded cards. The goal fitted in one sentence: anyone, from the age of 12, should understand a figure in one second.
- 03A country keeps the same colour in every chart on the site. You follow France from the country page to the comparison without re-reading the legend.
- 04Every value is followed by a plain sentence, and by a short warning when there is a trap: Ireland is not twice as rich as France, Malta imports its electricity.
- 05Two directions were dropped before this one: an editorial, newspaper-like version, paper ground and serif, too heavy to read; and a dark trading-terminal version, too aggressive for a general audience.
A materialised view behind every read: measured under 10 ms across 2.8 million rows of observations.
Something similar in mind?
Describe your situation. I'll tell you what's realistic,
in what order, and what I'd do differently.